Chapter 1 Data Organization with Spreadsheet
Any research project’s cornerstone is good data organization. Because most researchers keep their data in spreadsheets, many research initiatives begin there.
In spreadsheets, we organize data in the ways that we wish to work with it as humans, while computers demand that data be organized in specific ways. We must organize our data in the way that computers require it in order to employ tools that make computation more efficient, such as programming languages like R or Python. Since most research projects begin here, we’d like to begin here as well!
However, you will not learn about data analysis with spreadsheets in this lesson. As a researcher, you’ll spend a lot of time organizing data so you can do good analysis afterwards. It isn’t the most enjoyable task, but it is important. This session will teach you how to think about data organization and some data wrangling best practices. This method allows you to properly prepare existing data and organize new data collection, resulting in less data wrangling.
1.1 Spreadsheet Programs
Good data organization is the foundation of your research project. Most researchers have data or do data entry in spreadsheets. Spreadsheet programs are very useful graphical interfaces for designing data tables and handling very basic data quality control functions.
Spreadsheet programs encompass a lot of the things we need to be able to do as researchers. We can use them for:
- Data entry
- Organizing data
- Subsetting and sorting data
- Statistics
- Plotting
1.2 Formatting data tables
The most common mistake is using spreadsheet tools as lab notebooks, relying on context, margin notes, and data and field spatial layout to convey information. We can (usually) interpret these things as humans, but computers don’t see information in the same way, and unless we explain everything to the computer (which can be difficult! ), it won’t be able to see how our data fits together.
We can handle and analyze data much more effectively and quickly with the help of computers, but we must first prepare our data so that the computer can interpret it (and computers are very literal).
Why aren’t we teaching data analysis in spreadsheets:
- Data analysis in spreadsheets normally requires a significant amount of human labor. You normally have to redo everything by hand if you want to alter a parameter or run an analysis with a different dataset. (We know you can make macros; nevertheless, see the next point.)
1.2.1 Problems with Spreadsheets
Spreadsheets are good for data entry, but we use them for much more than that. Use them to create data tables for publications, generate statistics and make figures. Spreadsheets can be used with caution if you want to replicate your steps in another person’s work.
1.2.2 Use of Spreadsheets for Data Entery and Cleaning
However, there are times when you’ll want to use a spreadsheet tool to make “quick and dirty” calculations or figures, and data cleaning will make it easier to do so. Data cleaning also improves the format of your data before it is imported into a statistical analysis program. We’ll show you how to use various spreadsheet tools to double-check your data quality and get preliminary summary statistics.
In this lesson, we will assume that you are most likely using Excel as your primary spreadsheet program - there are others (gnumeric, Calc from OpenOffice), and their functionality is similar, but Excel seems to be the program most used by everyone.
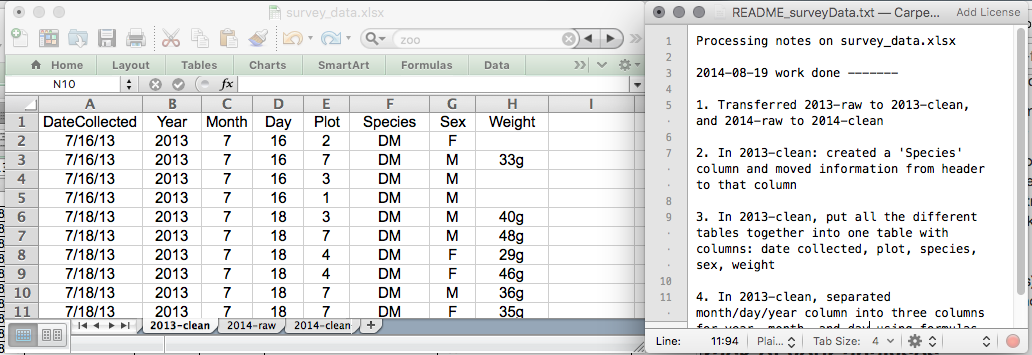
1.2.3 Keeping track of your analyses
It’s very simple to end up with a spreadsheet that looks nothing like the one you started with when dealing with spreadsheets for data cleaning or analytics. If a reviewer or instructor requests a new analysis, you should be able to recreate your analyses or figure out what you performed.
- Make a new file containing the data you’ve cleaned or examined. If you change the original dataset, you’ll lose track of where you started!
- Keep a record of the steps you did to clean up or analyze your data. These stages should be tracked just like any other phase in an experiment. This should be done in a plain text file located in the same folder as the data file.
Keeping track of your analyses
1.2.4 Structuring data in spreadsheets
The cardinal rules of using spreadsheet programs for data:
- Put all your variables in columns - the thing you’re measuring, like ‘weight’ or ‘temperature’.
- Put each observation in its own row.
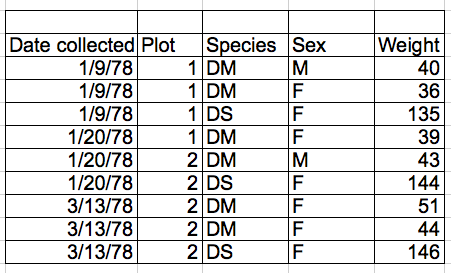
- Don’t combine multiple pieces of information in one cell. Sometimes it just seems like one thing, but think if that’s the only way you’ll want to be able to use or sort that data.
- Leave the raw data raw - don’t change it!
- Export the cleaned data to a text-based format like CSV (comma-separated values) format. This ensures that anyone can use the data, and is required by most data repositories.
Exercise:
What is the issue with the following data entry according to spreadsheet data structure rules above?
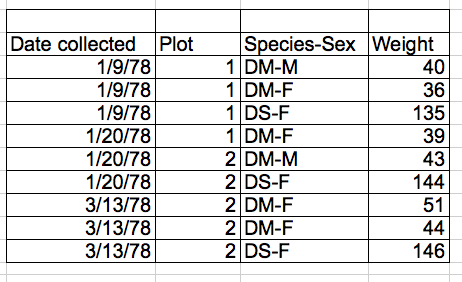
multiple-info example
1.3 Common Spreadsheet Errors
- Don’t create multiple data tables within a single spreadsheet. This
creates false associations between things for the computer, and
makes it harder to sort and sort your data in the right order.
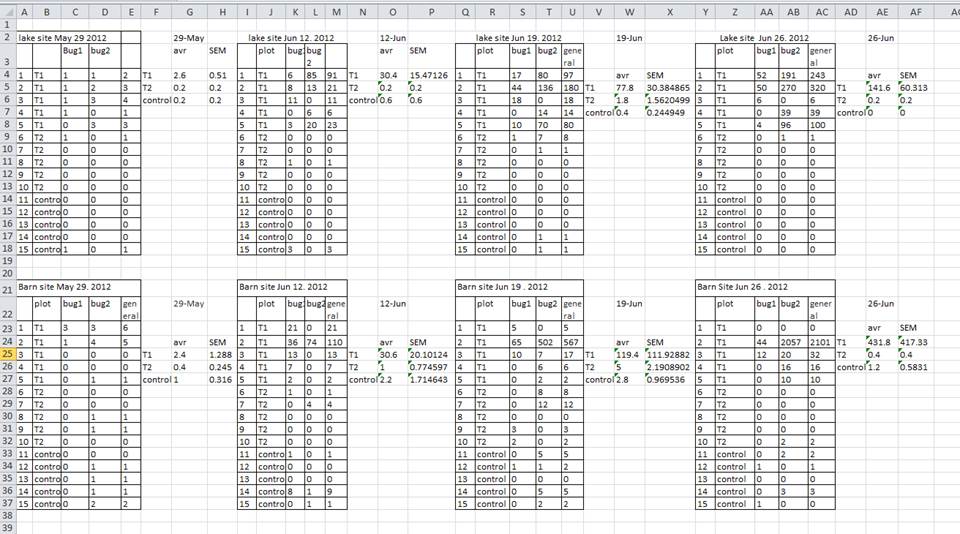 In the
table below, each row in A-F represents four distinct samples. This
means that the columns A-AF do not all refer to the same sample.
In the
table below, each row in A-F represents four distinct samples. This
means that the columns A-AF do not all refer to the same sample.
1.3.1 Using multiple tabs
- When you create extra tabs, you fail to allow the computer to see connections in the data that are there (you have to introduce spreadsheet application-specific functions or scripting).
1.3.2 Not filling in zeros
There’s a difference between a zero and a blank cell in a spreadsheet. To the computer, a zero is actually data. By not entering the value of an observation, you are telling your computer to represent that data as unknown(otherwise known as a null value). This can cause problems with subsequent calculations or analyses.
1.3.3 Using problematic null values
There are a few reasons why null values get represented differently within a dataset. Sometimes confusing null values are automatically recorded from the measuring device. It’s a problem if unknown or missing data is recorded as -999, 999, or 0.
Many statistical applications won’t detect them as missing (null) values. The tools you select to evaluate your data will determine how these values are interpreted. It is critical to utilize a null indicator that is clearly defined and consistent. As a result, Blanks (for most applications) and NA (for R) are excellent options.
1.4 Date as data
It is much safer to store dates with [MONTH, DAY and YEAR] in separate columns
Excel is unable to parse dates from before 1899-12-31, and will thus leave these untouched.
If you’re mixing historic data from before and after this date, Excel will translate only the post-1900 dates into its internal format
Ideally, data should be as unambiguous as possible.
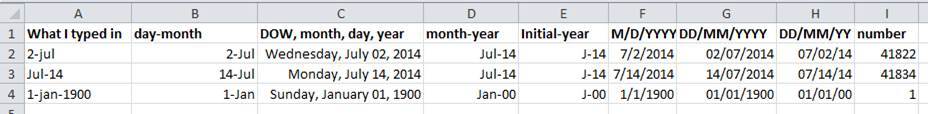
Many formats, many ambiguities